This is a sample of Zeitmaps usage on phasing and traffic planning of a complex graded interchange.
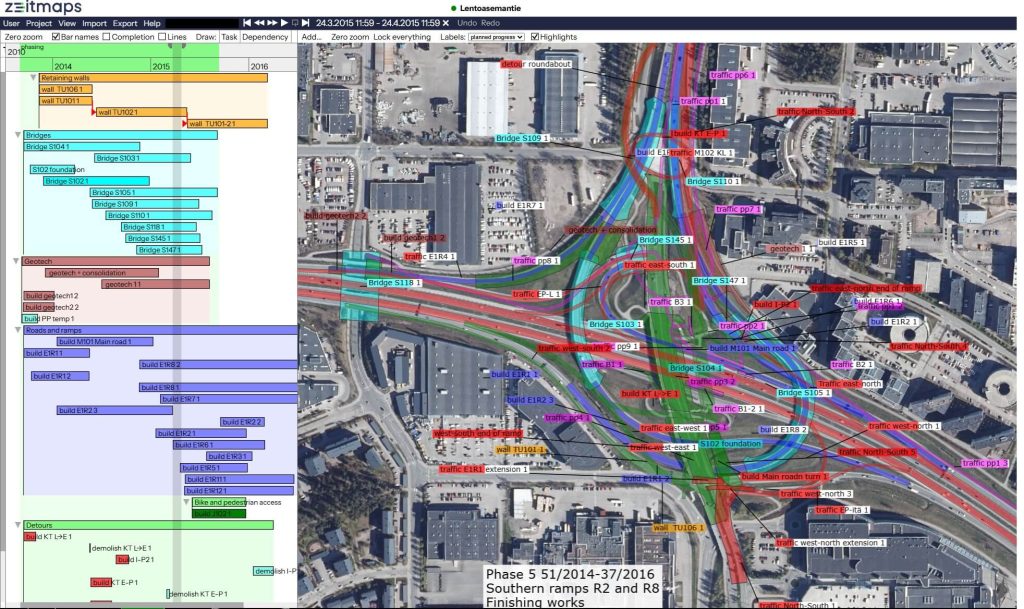
Zeitmaps personnel were involved in the project in the early 2010s, so we decided to use this as demo material.
The goal of the project was to eliminate all traffic lights in the interchange. This would be achieved by building 10 new bridges and ramps to bridges and a roundabout to the north of the interchange.
The planning challenge was to keep the roughly 50 000 daily cars, bikes and buses always flowing through the interchange. Here’s the process phase by phase how this would be planned using Zeitmaps.
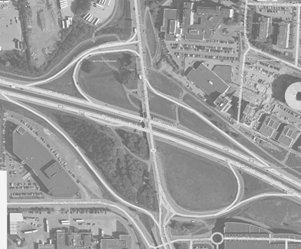
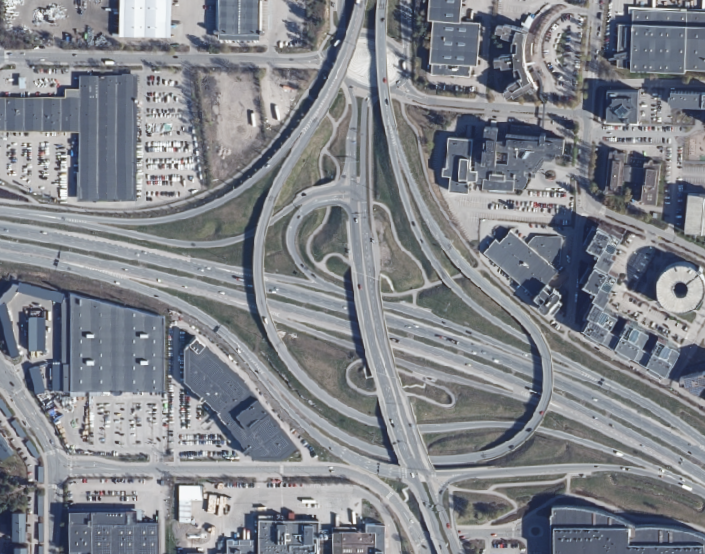
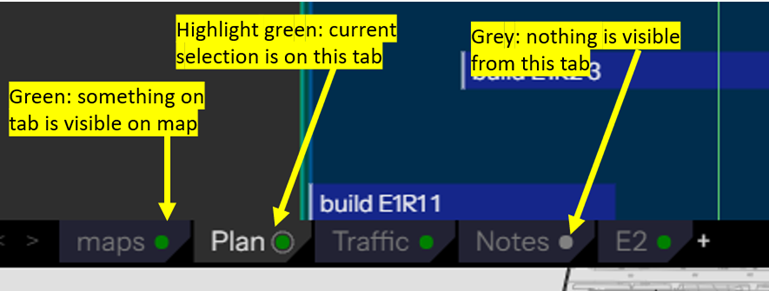
1. Start by importing the, orthophotos, tilemaps and design drawings to the correct coordinate systems and placing imported files to their own tab. (Maps tab)
2. Create another tab to define current traffic areas: cars, bikes, bus stops etc. I usually use red for vehicle traffic, magenta for bikes (link to 11/09/2013) to get an understanding of current conditions. This would also be a good time to draft notes to the map about current conditions and add photos or other additional or background information. (Traffic tab)
3. Next again on a separate tab define locations of main structures. In this case I trace all the bridges, new ramps, major retaining walls and geotechnical areas on their own tab and give them some approximate durations. These can be grouped to develop a location breakdown structure. (Plan tab)
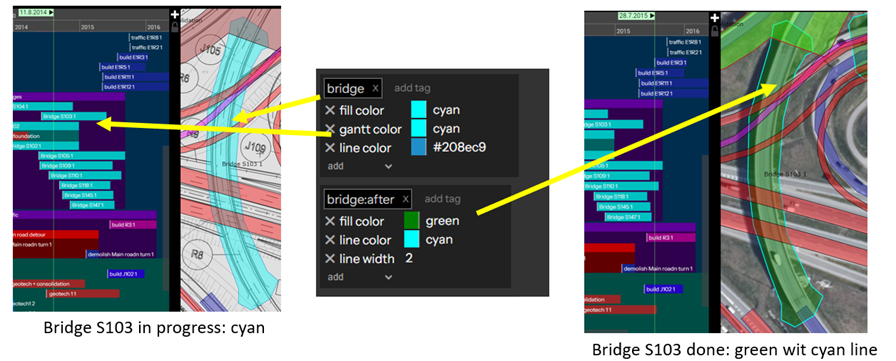
4. Now would be a good time to think about Styles. Styles define the tags that can be assigned to tasks for visual representation. For example, the bridge tag in the project is shown in the adjacent picture:
5. After locations and durations are somewhat mapped out, it’s a case of planning tetris. So move tasks and adjust traffic phasing accordingly. The best tools in Zeitmaps for this are the control date (click and drag on top of calendar), save snapshots using backup and restore tool (for alternatives. you can return to these later).
I tend to lose things while planning so I use the zoom to in context menu and tab tools to find them.
Importing data
Using a combination of tools like Excel, MS Project, Topcon Project, Autocad etc define a construction duration for all the locations in the project. Usually, the location breakdown has to be changed a few times as the first guess is never the best one. Ramps need to be built in stages and temporary structures are required for traffic. Data can be imported to MS Project (location breakdown, for example) and imported back in the Zeitmaps if a proper schedule is developed elsewhere.
So this explains one way to get started in planning. I still think tools like this are pretty new and the best practices of “visual scheduling” are yet to be developed. I will walk through my planning process and critical path of the project in a future article.
Click here to take a look at the project yourself.
Author: Juuso Mäkinen
Do you want to try using Zeitmap in your own projects? If you have any questions, feel free to contact us, we will be happy to help.